If you are responsible for health & safety of people who work with chemicals, you may be thinking about how to determine how many samples to collect, or if you really need to monitor. Dr Manning offers guidance on evaluating Safety Data Sheets and how to address workplace exposure variation. Learn more by reading our article below.
Worker Chemical Exposure – Do We Really Need to Monitor?
If you’re responsible for the health and safety of people who work with chemicals, personal monitoring badges are a cost-effective, convenient way to assess employee exposures. BUT first, how can I determine whether I need to monitor at all?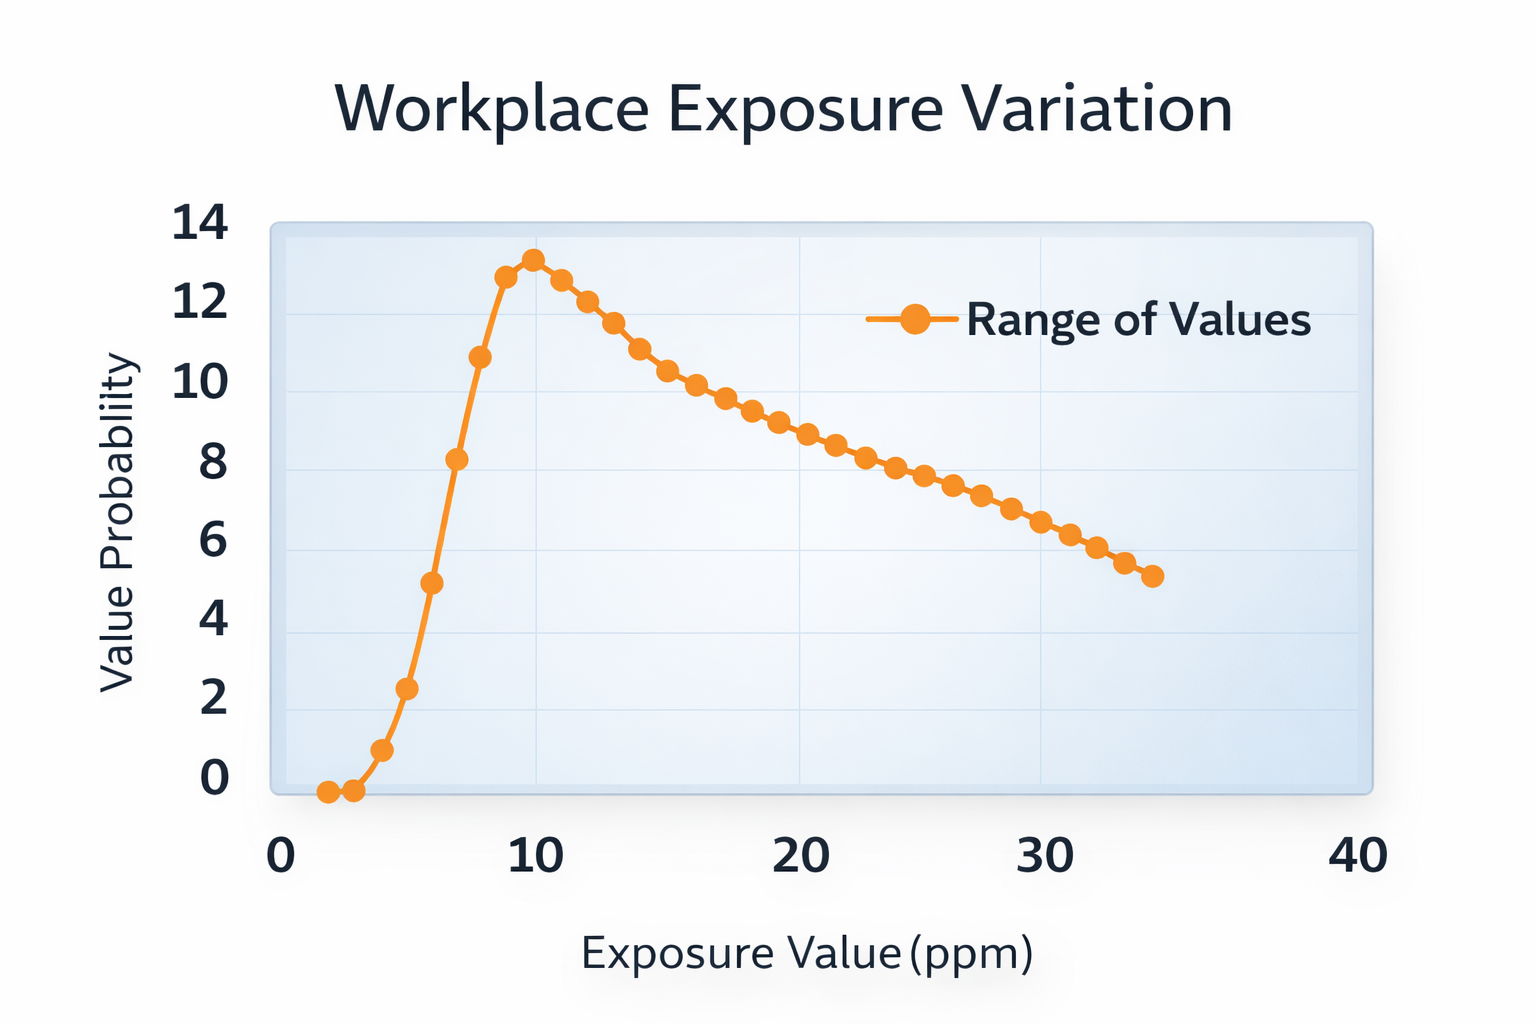
While some believed that workplace exposures were constant and uniform, history has shown workplace exposure to be variable, changing from day-to-day and by location. Worker exposure should be viewed, not as a single value, but as a distribution of values with a probability of being within a range.
Exposure assessment is more like a weather forecast that gives a probability of rain or temperature falling within a certain range.
Safety Data Sheets (SDS)
Your vendor for each chemical purchased should provide you with a Safety Data Sheet (SDS) that includes the Occupational Exposure Limit (OEL) for each chemical you purchase. This OEL is considered by toxicologists as the highest “safe” Exposure Level (concentration), an Exposure Level at which a worker will suffer NO HARM.
Workers are considered “chemically exposed” if they may be daily exposed to chemical concentrations at >10% of an OEL. That is, if the OEL listed on your SDS is 100 parts per million (ppm), workers are considered “chemically exposed” if some of them may daily experience concentrations >10 parts per million (ppm). From the vapor pressure of your chemicals and other data, an Exposure Assessment expert may use a model to predict in theory whether your workers may be chemically exposed (at >10% of the OEL). If no such expert is available, you can do a simple exposure assessment on workers over a work shift using personal monitoring badges.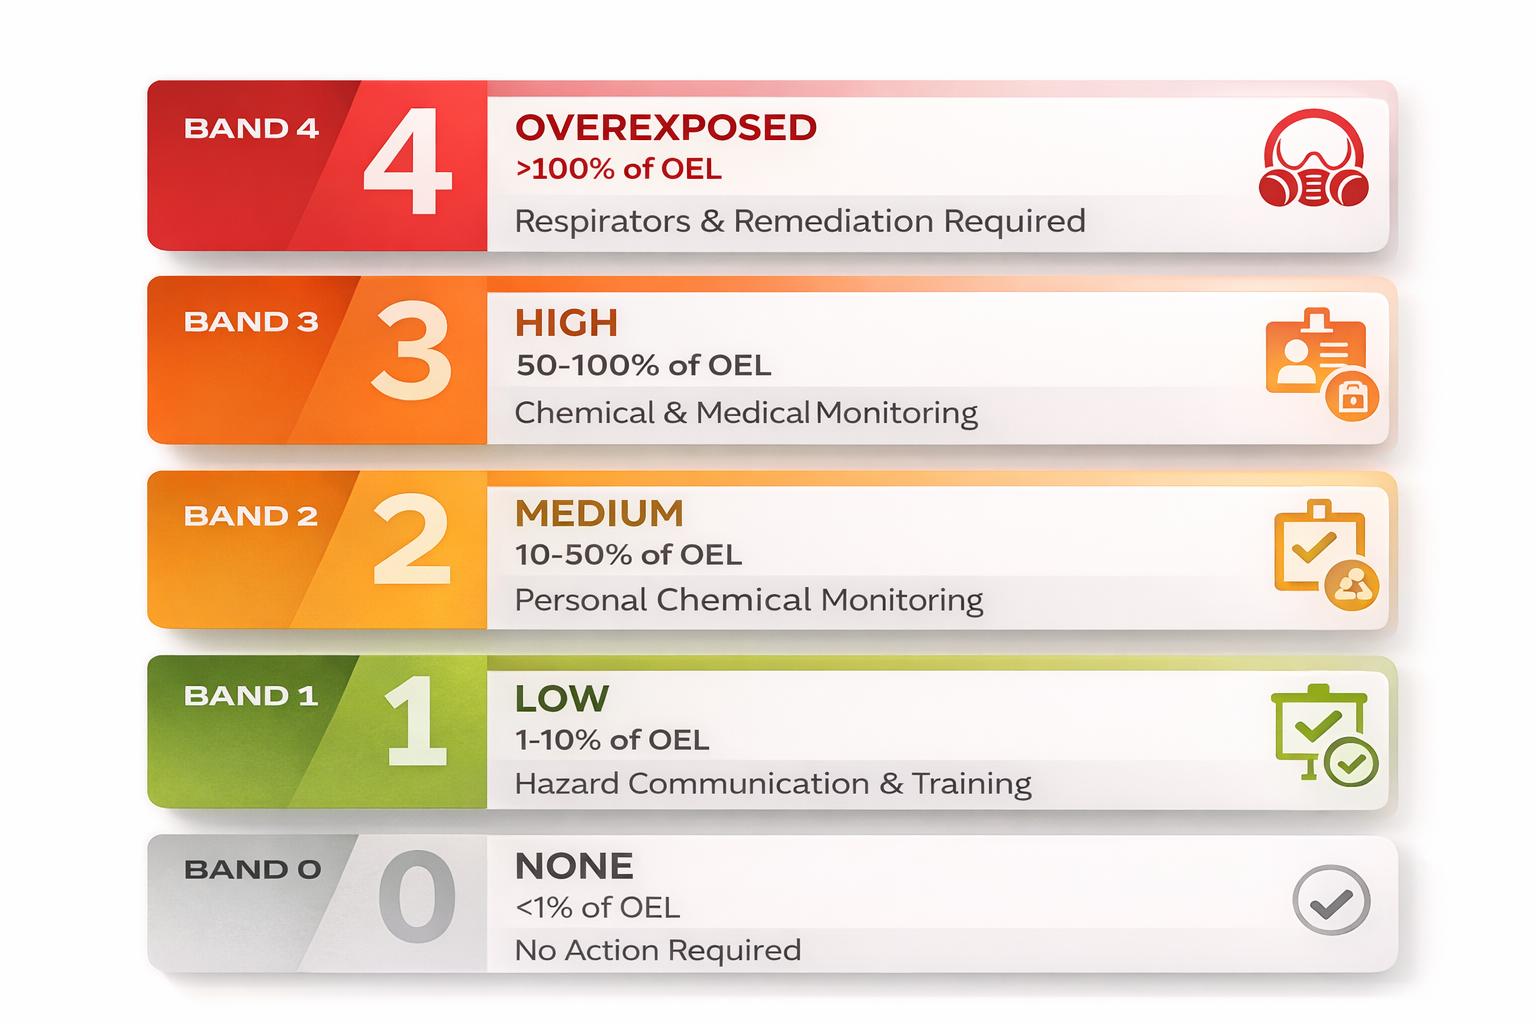
After badges have been sent to a qualified (accredited) laboratory, test results entered into a software called IH Data Analyst (IHDA), available at no cost from AIHA , the a American Industrial Hygiene Association, enables you to express results as the probability of workers’ exposure falling within each of five (5) Exposure Bands as shown to the left.
If initial results suggest your group falls within Band 0 (None) or Band 1 (Low), you will not need to continue to monitor. If initial results suggest your group is in Band 3 (High) or Band 4 (Over Limit), you will need to continue to monitor employees. If initial results suggest your group is in Band 3 (Med), you should repeat initial testing, but may discontinue if your group trends toward Band 1 (Low) or Band 0 (None).
In initial tests, IHDA may report a significant probability of workers being within more than one Exposure Band. As you collect more samples, the probability of workers being in a particular exposure band will approach 75%. At that point, you have sampled till you’re sure which Exposure Band your workers are in. The AIHA guidelines provide Actions to follow depending on which Exposure Band your workers fall into.
For more in depth information, please also explore these two blog posts: