Welcome to our in-depth blog series: How Many Samples to Collect? Sample Till You’re Sure.
Gus Manning, Chief Technical Officer & company founder, has made it his life’s work to bring accurate, cost-effective, and easy-to-use samplers to the workplace and make work environments safer for workers. The OSHA enforcement strategy – assuming workplace exposures could be well characterized by a small number of samples – has been found deficient in a number of classic studies, cited in this series.
Background
Since standard error decreases as you do more testing, it is an axiom that you collect more samples when a measured parameter has high variation. OSHA enforcement strategy (assuming workplace exposures could be well characterized by a small number of samples) was found deficient when classic studies (1,2,3) revealed that workplace variation is typically much higher than many practitioners had thought.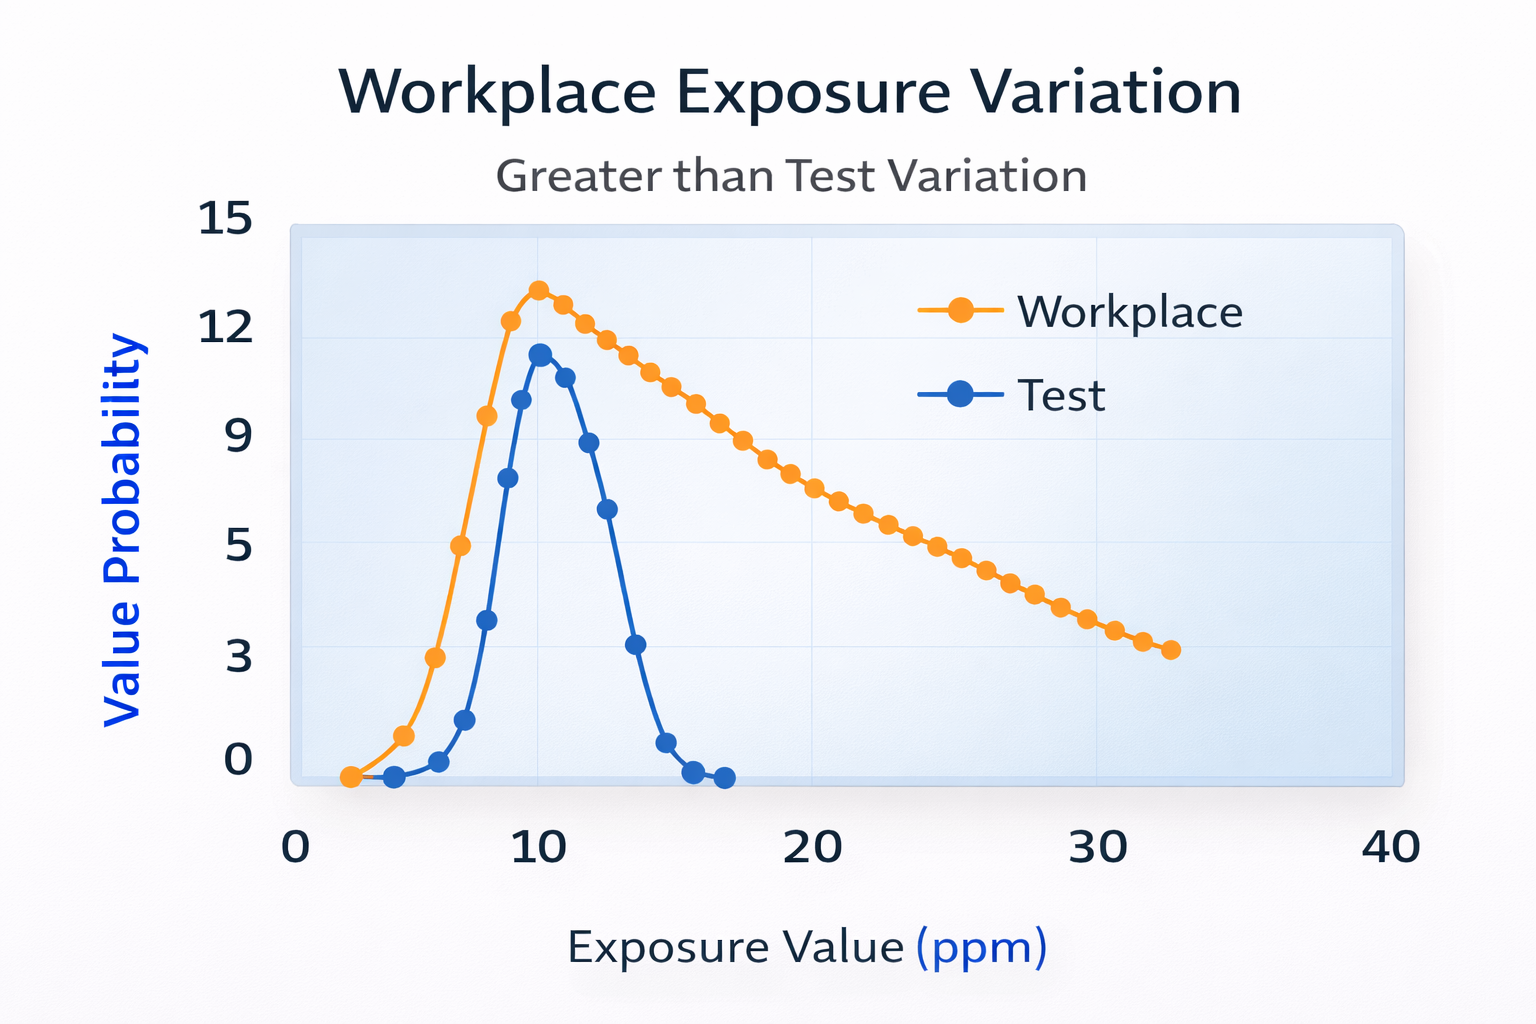
More recently, AIHA’s Exposure Assessment Committee discovered that IH practitioners tend to underestimate exposures when reviewing workplace exposures, because workplace exposures tend to have high variation that follows a skewed (lognormal) pattern rather than the normal (Gaussian) pattern (as illustrated in the graphic).
In response to these findings, the AIHA has created a new approach to workplace sampling strategy and offered new tools and training. The AIHA training course Making Accurate Exposure Risk Decisions (4) intends to assist an IH in improving their judgments of skewed (lognormal) exposure data, while the new tool IH Data Analyst (5) is a computer program that analyzes exposure data and helps a practitioner classify workplace exposure data for a group within one of five possible exposure bands.
Let’s discuss these tools and the ideas behind them as simply as we can.
Exposure Risk Questions & OELs
To address the question: Are workers exposed to unsafe levels of chemicals? Several organizations including NIOSH, OSHA, and ACGIH issued OELs (Occupational Exposure Limits) for many chemicals. Each OEL is meant to be the level at which an employee exposed for an entire working life would suffer no harm. Thus, an OEL is “the highest safe level”, since a higher level would be “unsafe”. In many instances OSHA, NIOSH, ACGIH have set different OELs for a chemical, so your organization must choose among them. Selecting a lower OEL will lower exposure risk.
With an OEL, the Exposure Risk question becomes: Are workers exposed above the OEL? A more rigorous question would be: What is the probability of workers’ exposure exceeding the OEL? This requires us to decide whether we mean any worker, most workers, or all workers.
Similar Exposure Groups (SEGs)
A Similar Exposure Group (SEG) is a group of workers with similar tasks, expected to have “similar” chemical exposures, and the SEG is analyzed together as a unit. An IH may initially classify employees into one or more SEGs depending on their tasks, but is free to later re-classify employees and re-define SEGs based on exposure data. Since classifying workers into SEGs helps the IH analyze Exposure Risks in a statistically meaningful way, it is a recommended practice.
Controlling Exposure Risk versus OSHA Compliance
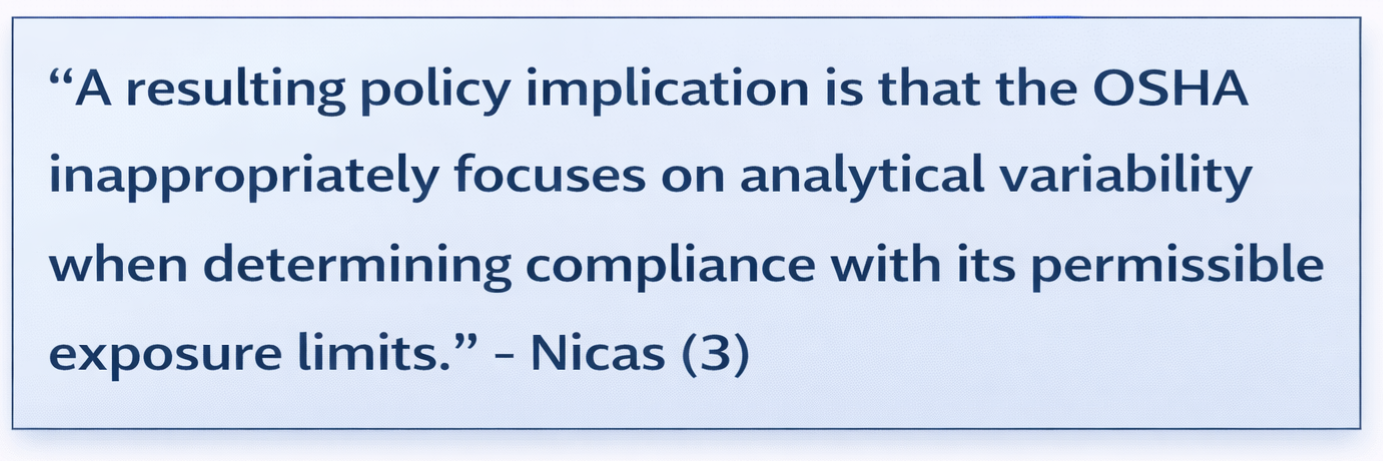
In a classic 1991 paper (3), Professor Mark Nicas suggested an OEL be interpreted as requiring that the 95th percentile of worker exposures are controlled below the OEL. Nicas noted that OSHA’s enforcement policy seemed to require 100% of exposures below the OEL since it may sanction an employer if one sample tested above the PEL. He also noted that, due to infrequent sampling, OSHA was unlikely to detect overexposures unless a majority of exposures exceeded the OEL. Nicas concluded that OSHA’s intentions were unclear leading to non-functional enforcement.
Recently, AIHA decided to promote a higher Standard of Care that would go beyond mere OSHA compliance and implement a Sampling Strategy, consistent with Nicas recommendations, that would ensure that the 95th percentile of worker exposures are controlled below the OEL.
AIHA Standard of Care
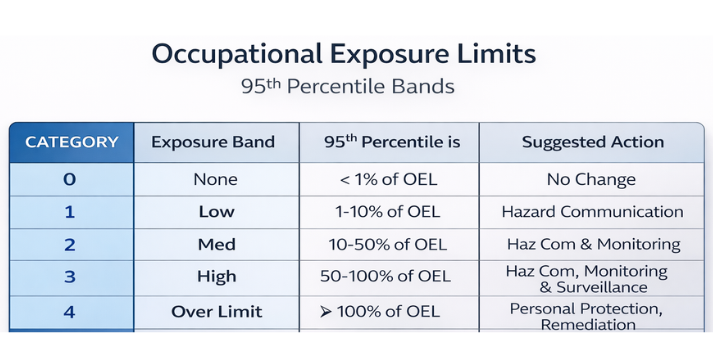
Under the AIHA Standard of Care, personal exposure samples are collected in the breathing zones of representative workers on representative days. When the results of samples (so collected) are entered into a statistical data system, such as the AIHA’s IH Data Analyst (4), the system can calculate a probability that allows one to classify the exposures of an employee group (SEG) within one of five possible Exposure Bands relative to the selected OEL.
Worker Exposure Categories
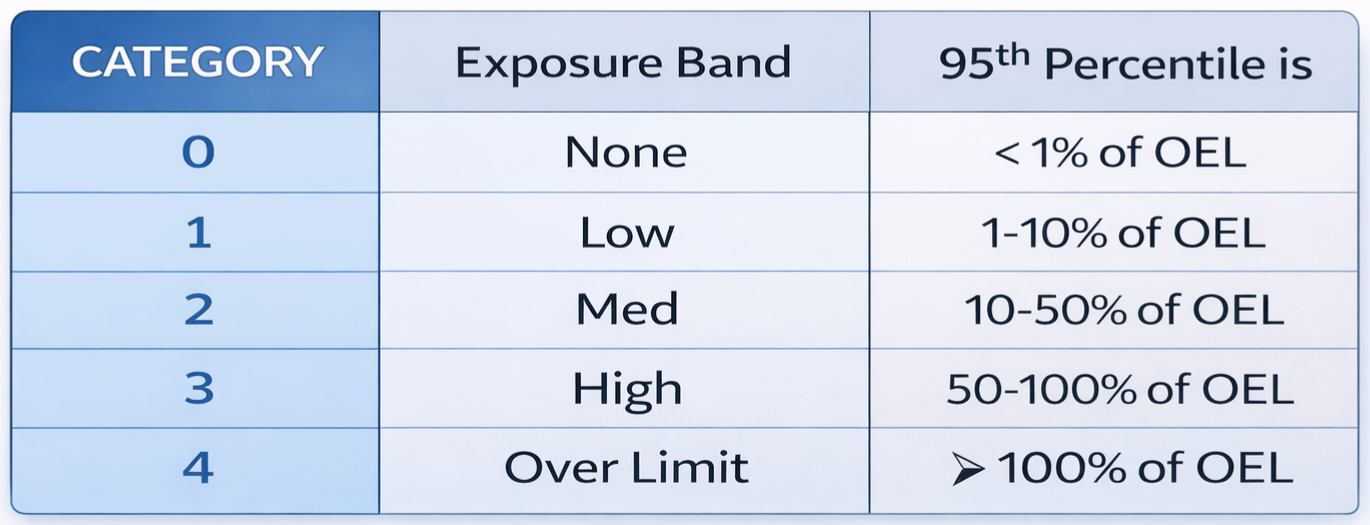
As part of its overall system, the possible exposure range are classified as 5 Categories or Exposure Bands, relative to the selected OEL, as follows.
 The IHDA (IH Data Analyst) works with the Table above. Given a population of personal exposure sample results, IHDA provides a graphical output to inform the user of the following:
- The degree of fit (agreement) with the (lognormal) statistical model
- The Probability that the 95th percentile exposure is within each of bands 0, 1, 2, 3, and 4.
- Other useful Information
Using the AIHA IH Data Analyst
The (free) AIHA Training is richer than what we describe here, but, essentially, the IHDA gives you the probability (degree of certainty) whether the SEG tested is within each of the Exposure Bands.
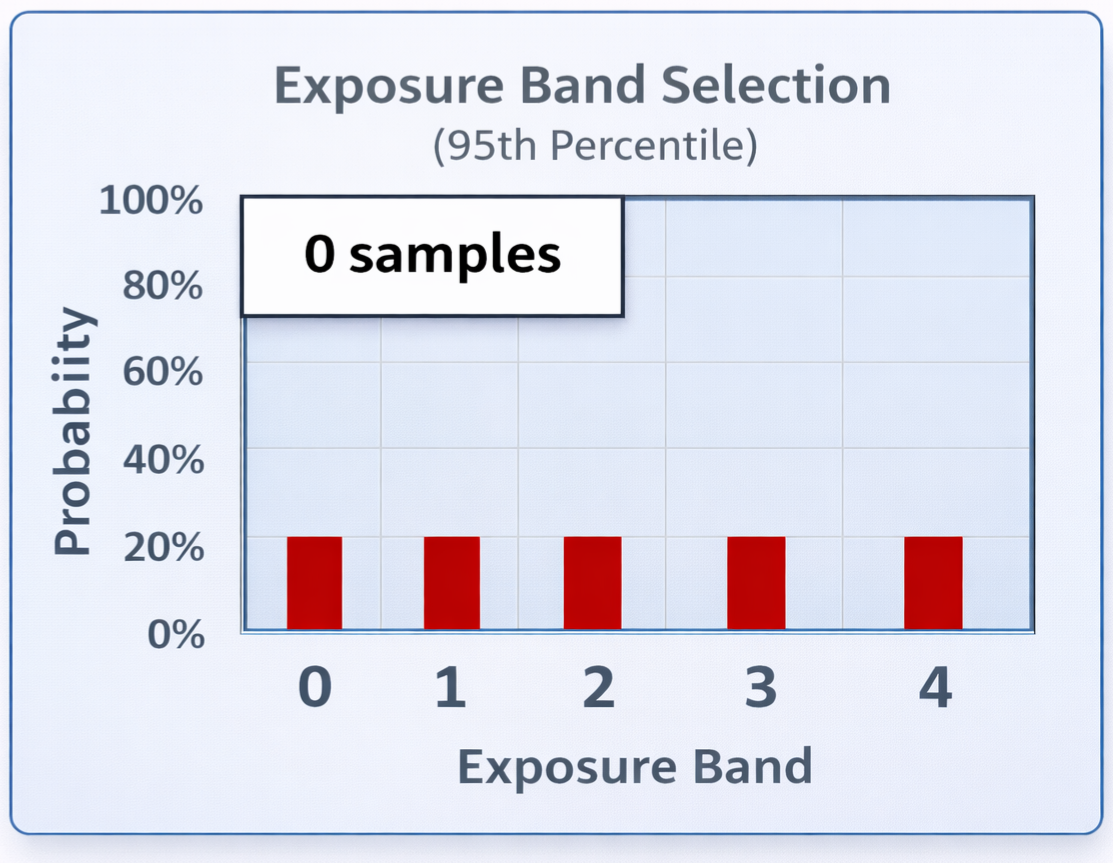
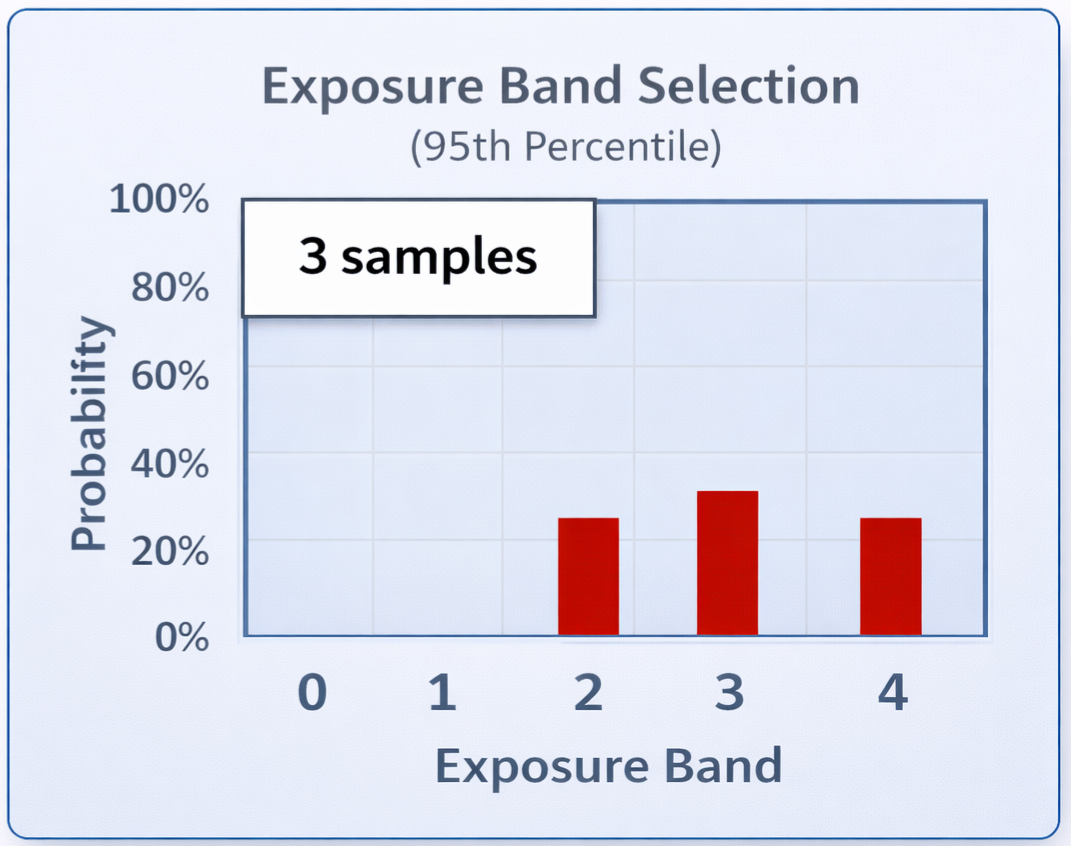
As an example, before you take any samples, you have a 20% probability of being in each of the 5 Exposure Bands (see left). After you have collected a small number of samples (see right), the IHDA will likely report a significant probability of being in each of several Bands. Since you have equal probability of being in several bands, you won’t be sure which band you are in, as yet.
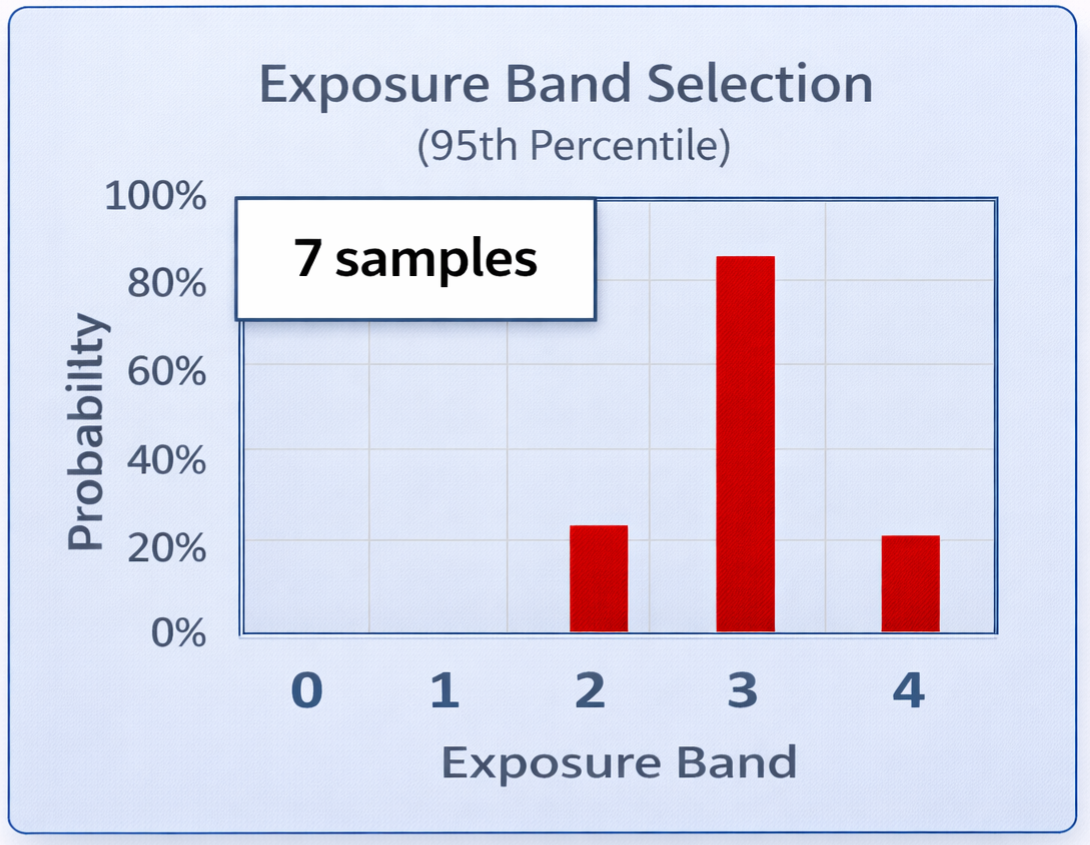
As you collect more samples representing the same SEG, the IHDA result will begin to approach higher certainty, i.e., a higher probability of being inside a single Exposure Band, and a lower probability of being in other Bands.
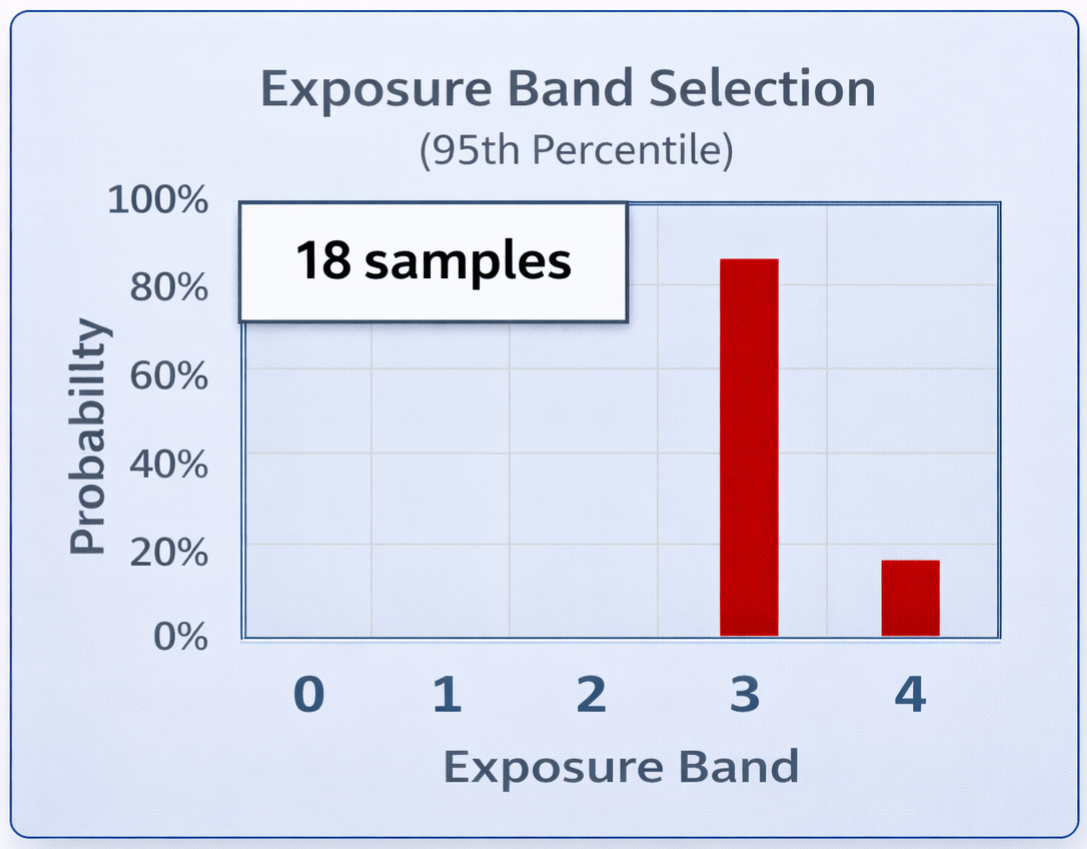
When the IHDA output reports greater than a 75% probability of being in a particular Band (and a low probability of being in other Bands), you will begin to feel “sure”, and you will have “sampled till you are sure”.
You are now free to access some of the AIHA free content in references (4) & (5).
References
(1)S. M. Rappaport, H. Kromhouta & E. Symanski (1993) VARIATION OF EXPOSURE BETWEEN WORKERS IN HOMOGENEOUS EXPOSURE GROUPS, American Industrial Hygiene Association Journal, 54:11, 654-662, DOI: 10.1080/15298669391355198
(2) Selection of the Measures of Exposure for Epidemiology Studies S. M. Rappaport Pages 448-457; https://doi.org/10.1080/1047322X.1991.10387912
(3) Nicas, M., Simmons, B. P., & Spear, R. C. (1991). ENVIRONMENTAL VERSUS ANALYTICAL VARIABILITY IN EXPOSURE MEASUREMENTS. American Industrial Hygiene Association Journal, 52(12), 553–557. https://doi.org/10.1080/15298669191365199
(4) Making Accurate Exposure Risk Decisions | AIHA
(5) IHDA-AIHA Tool Download | AIHA

Gus’s work for this series is grounded in the AIHA’s Exposure Assessment Committee’s finding that IH practitioners may underestimate exposures when reviewing workplace exposures, because workplace exposures tend to have high variations that follow a skewed (lognormal) pattern, rather than a normal (Gaussian) pattern.
Part 1 of this series expands the concepts of the AIHA training course, Making Accurate Exposure Risk Decisions.
Click the link below to view Part 2.
How Many Samples to Collect? Sample Till You’re Sure, Part 1 by Gus Manning, PhD, CIH.
Questions? Please contact us by email or call 800-833-1258.